

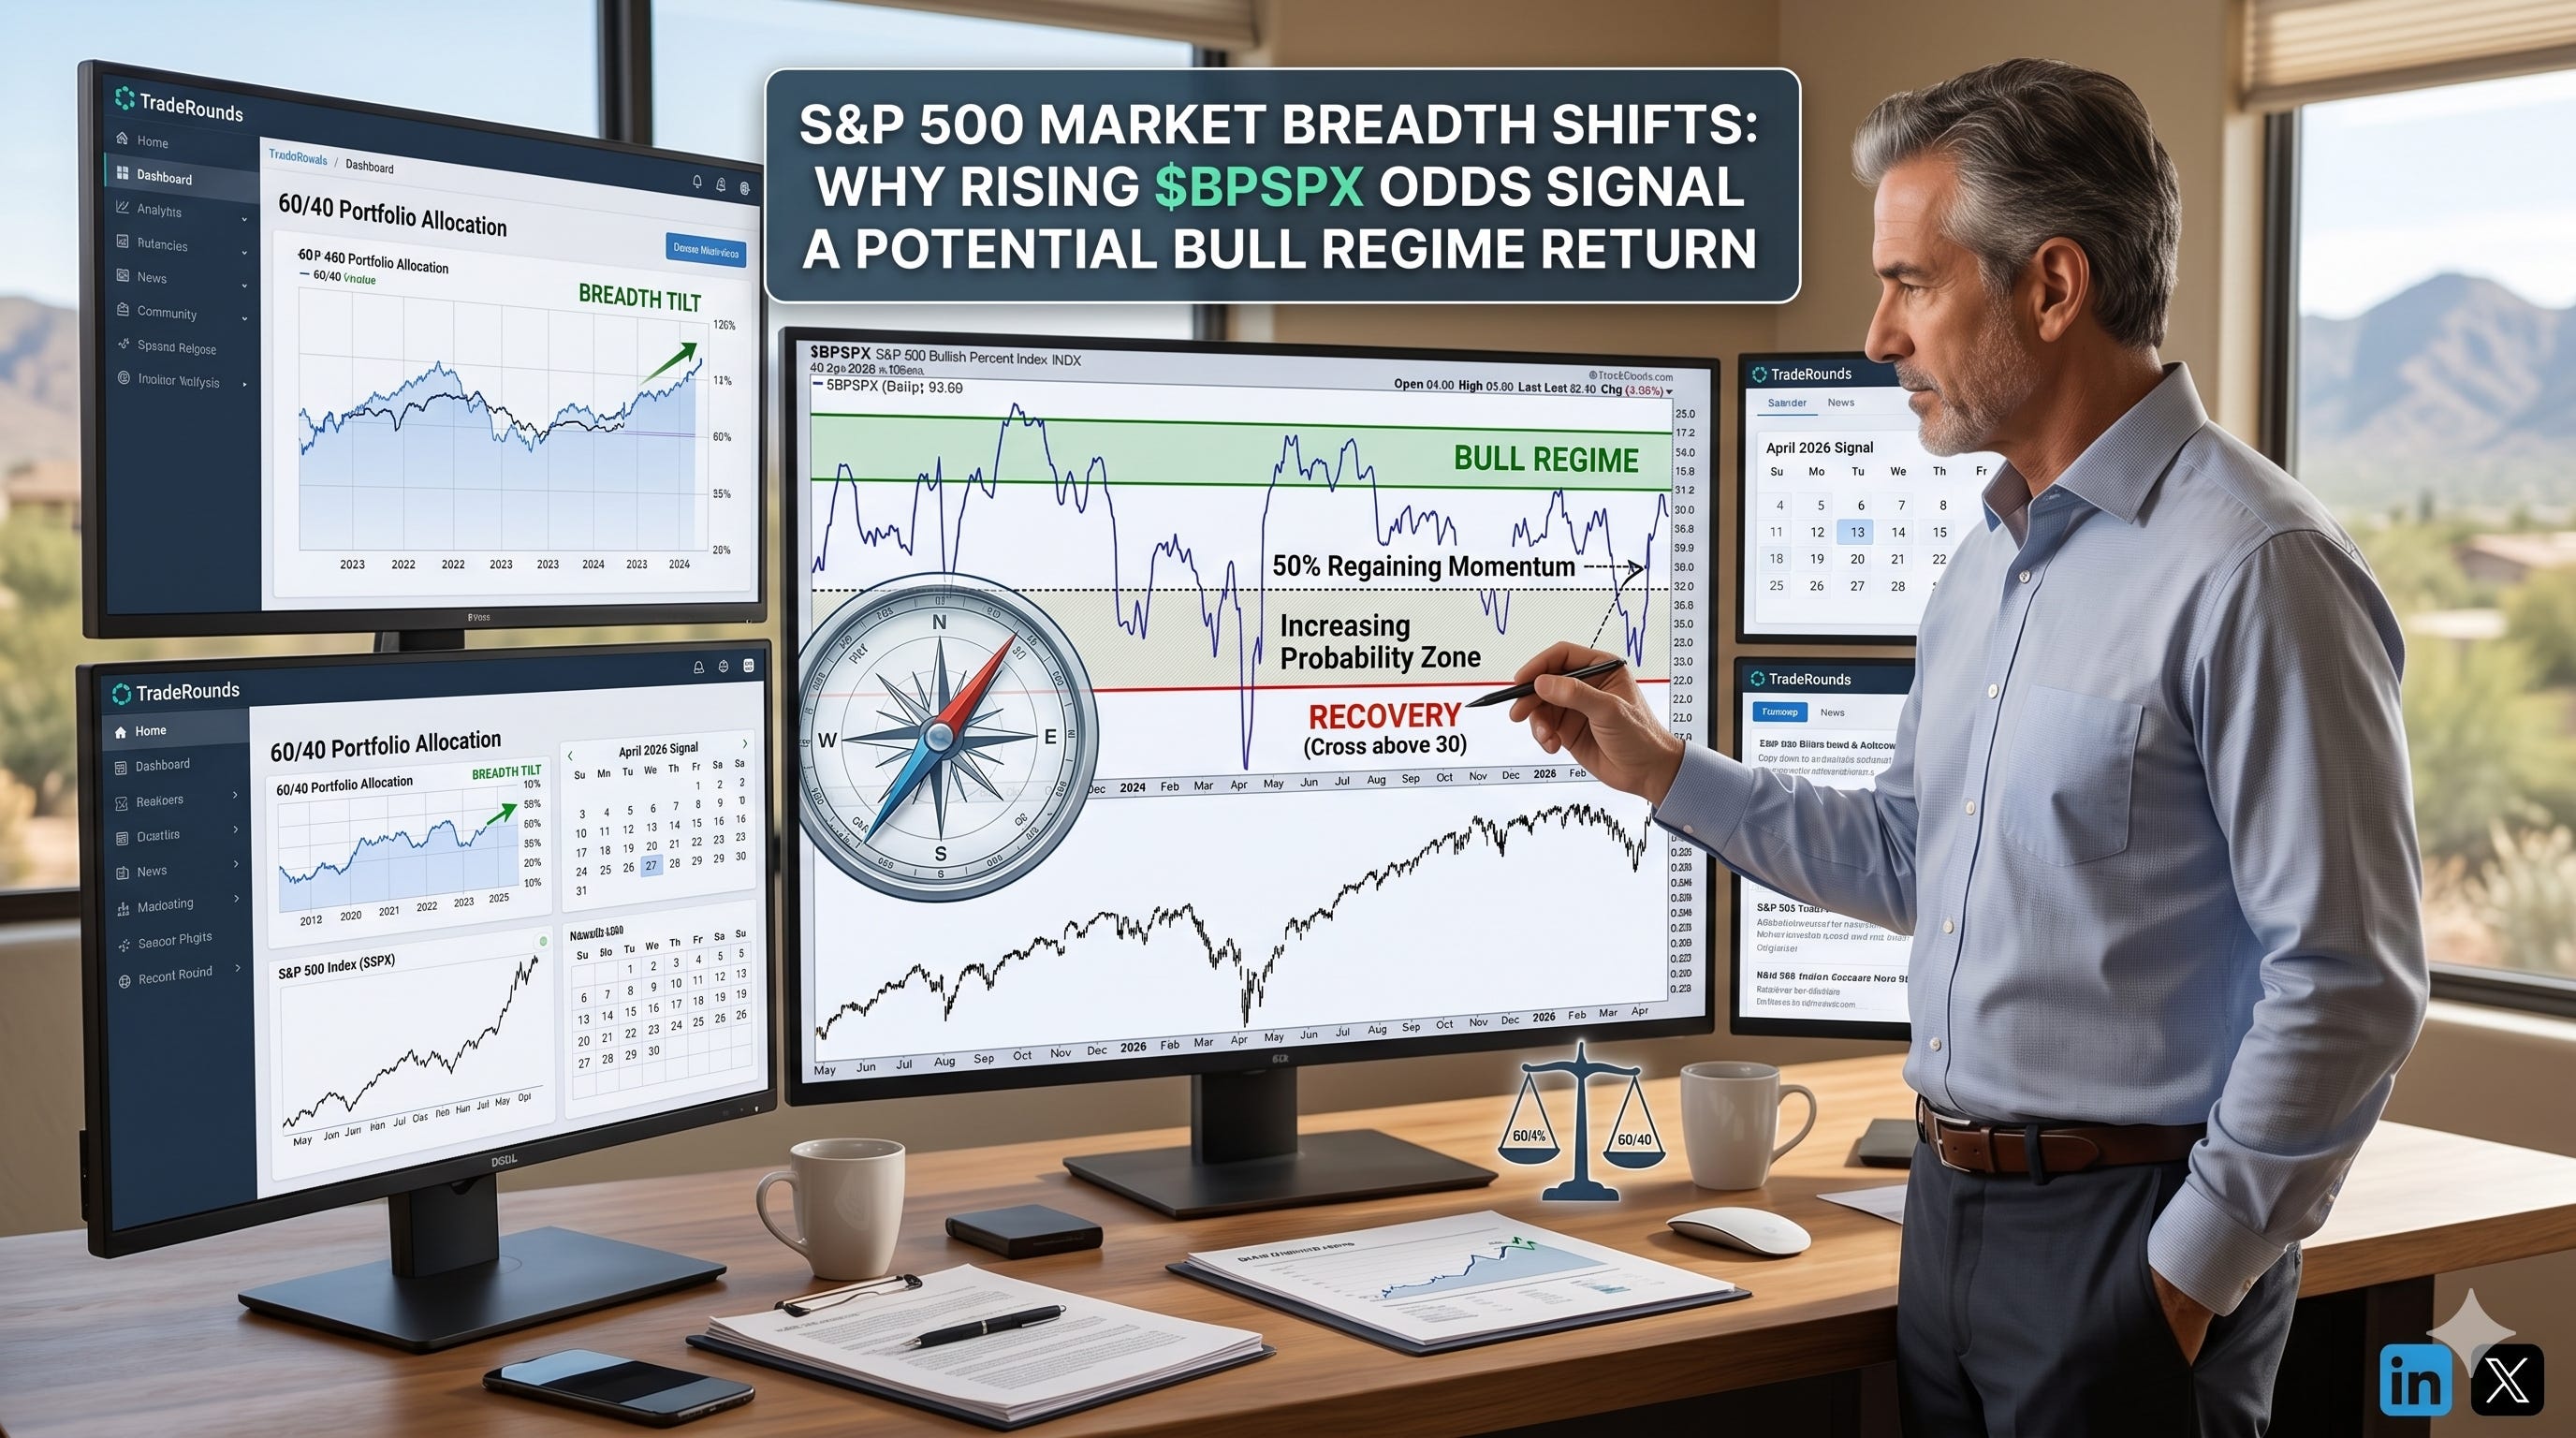
S&P 500 Market Breadth Shifts:
Why Rising $BPSPX Odds Signal a Potential Bull Regime Return

In the current market landscape, the heavy concentration of mega-cap names has made the S&P 500 price chart a potentially deceptive indicator of true market health, while the index may climb to new highs, the underlying participation of its constituent stocks often tells a different story. The following analysis, built upon the framework established by Cedric Thompson at StockCharts, utilizes the S&P 500 Bullish Percent Index ($BPSPX) to identify when the internal engine of the market is actually shifting gears, moving beyond the noise of market-cap weighting.
Visualizing the Breadth Shift
The chart provided by StockCharts below illustrates the critical relationship between the $BPSPX and the S&P 500 ($SPX) through late April 2026, it highlights how breadth serves as a confirming indicator during periods of volatility.
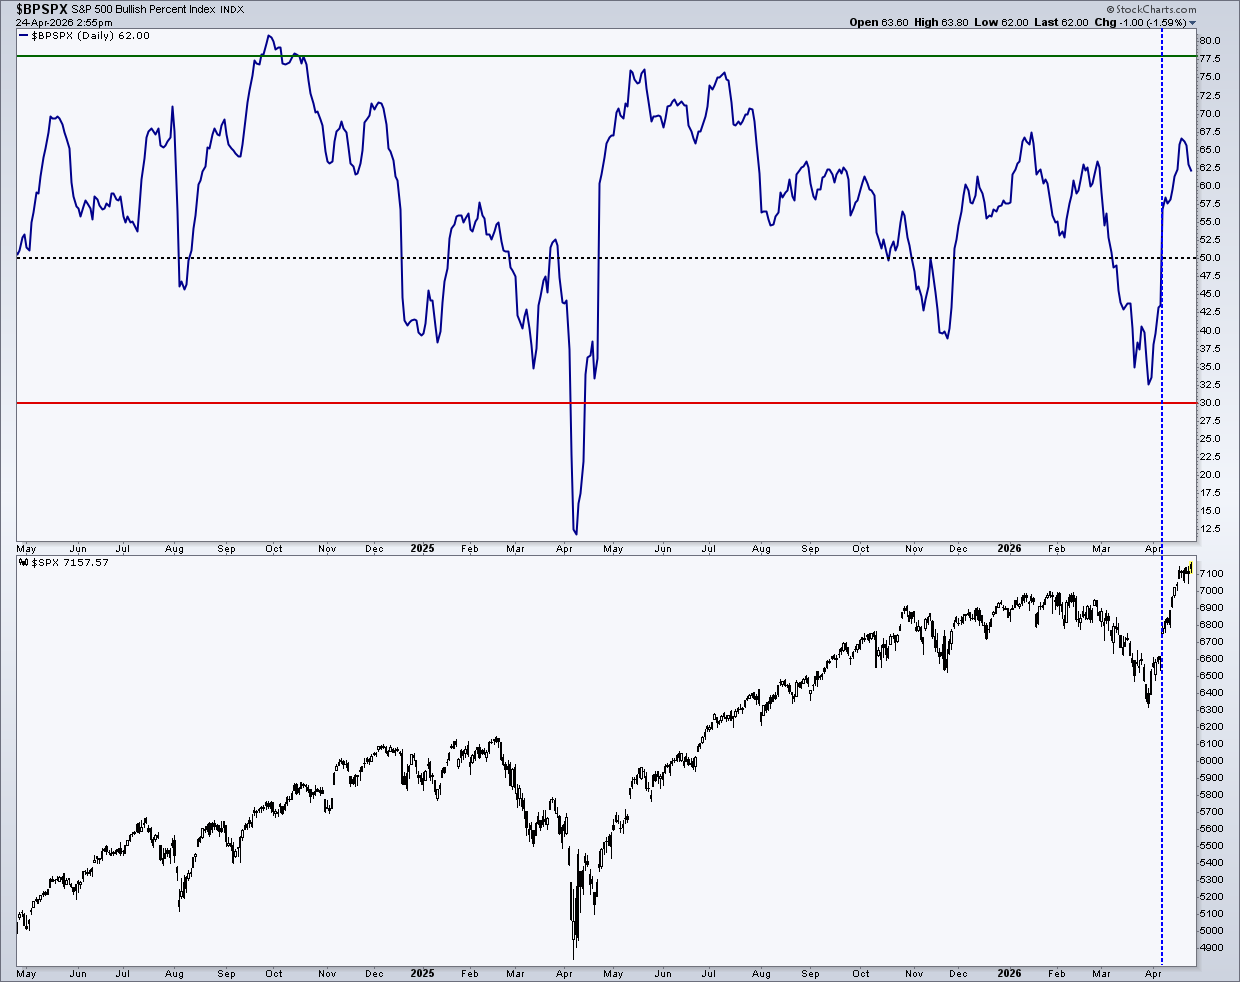
Source: StockCharts.com, Cedric Thompson. Data as of April 24, 2026.
The Logic of Probabilistic Breadth
The $BPSPX is unique because it is built on Point and Figure charting, which ignores the passage of time and minor price fluctuations to focus purely on trend reversals, a stock only contributes to the bullish side of this index when it triggers a definitive P&F buy signal. By measuring the percentage of S&P 500 stocks currently in bullish patterns, we gain a clear view of market participation, when the $BPSPX crosses above the 50 percent mark, as seen in the recent April surge, it signifies that a majority of the index is participating in the uptrend.
It is vital to remember that these signals represent an increase in probabilities, not a guaranteed outcome, history shows that when the $BPSPX clears 50, the S&P 500 has a 69 percent chance of being higher one year later. While these are favorable odds for a return to a bull regime, the remaining 31 percent represents the “failure rate” where macro shocks or hidden sectoral weakness can still derail the momentum.
The Bearish Blindspot: Why This is Not an “Exit” Tool
Despite the strength of the bullish signals, we must address a significant critique of the $BPSPX method, it is a poor bear market timing tool. Because the index is a lagging indicator, breadth often only confirms a breakdown after a significant portion of the price damage has already occurred, furthermore, bearish signals, such as a cross below 70 or 50 are statistically less predictable and lack the high-probability “edge” found in the bullish recovery signals.
In a modern regime dominated by high index concentration, the $BPSPX can remain deceptively high while the largest caps begin to roll over, or conversely, it can “trap” traders into exiting too early during a healthy mid-cycle correction. For the TradeRounds member, this means the $BPSPX should be used to “get long,” but your primary price-based stop-losses and macro filters must be the tools that “get you out.”
TradeRounds Strategy Integration
For a structural 60:40 framework, the current chart positioning offers a clear set of actionable, risk-adjusted regimes:
The Recovery Signal: The bounce off the red 30-line in late March was the high-probability entry signal to begin shifting toward equity exposure.
The Momentum Confirmation: The current reading of 62.00, comfortably above the dotted 50-line, indicates a healthy environment where a standard 60:40 allocation is well-supported by internal participation.
The Risk Management Clause: Because the $BPSPX has a “bearish blindspot,” the 40 percent bond or cash cushion remains your primary defense, do not wait for a $BPSPX cross below 50 to protect capital, instead, use that signal only as a final confirmation that the regime has officially shifted to defensive.
Final Verdict
The latest data confirms that the “wind is at the back” of the S&P 500, with 62 percent of the index currently on P&F buy signals, the rally has the broad participation necessary to sustain itself into late 2026. While the $BPSPX is a masterful tool for identifying the start of a bull regime, it requires the discipline of a structured 60:40 exit strategy to account for its inherent lag during market downturns.