

🧠 Dual Momentum Strategy Analysis: Is it Still the Best Way to Beat the Market in 2026?
A critical, data-driven autopsy of the classic Dual Momentum strategy. We break down its performance mechanics, potential flaws, and whether it fits a modern portfolio

Can you beat the market using a simple rotation between U.S. and international equities, and step aside when neither looks good?
That’s the promise of Gary Antonacci’s Dual Momentum strategy, a fan-favorite in tactical allocation circles. Built on behavioral and academic underpinnings, the model combines relative momentum (which asset is stronger?) with absolute momentum (is it rising at all?) to supposedly deliver superior returns and lower drawdowns.
But 10+ years after its popularization, how has Dual Momentum really held up? Let's break it down.
📘 The Original Model
From Antonacci’s book Dual Momentum Investing (2015), the core strategy goes like this:
Universe: U.S. equities (e.g., SPY) vs. International equities (e.g., VEU)
Relative Momentum: Look at 12-month total return of each.
Absolute Momentum: If the winning asset has a positive 12-month return, invest in that. If not, move to cash or short-term bonds (e.g., BIL).
Rebalance: Monthly
This is sometimes called the Global Equity Momentum (GEM) model.
📈 Backtest Brilliance: What the Hype Promised
Antonacci’s original backtest (1974–2013) showed:
CAGR: ~17.4%
Max Drawdown: ~-22%
Sharpe Ratio: ~0.9
That’s compared to a ~9–10% CAGR and -50% drawdown for a U.S. equity buy-and-hold investor.
Pretty impressive. But let’s fast-forward to real world results.
📉 Real-World Returns (2015–2024)
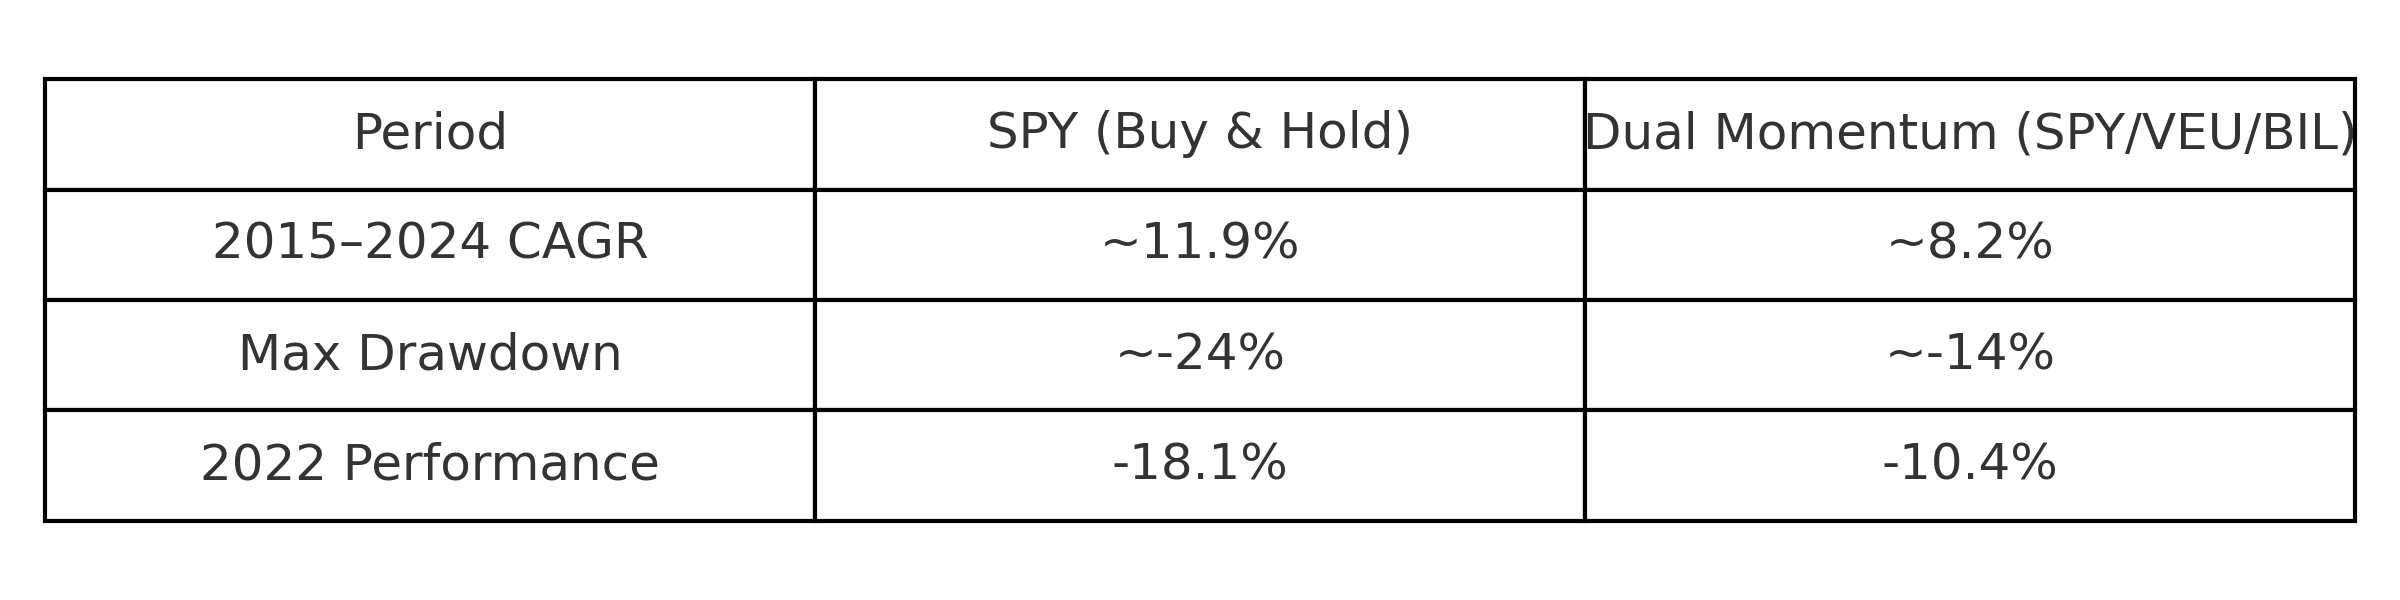
⚖️ What It Does Well
Risk Management: Avoids major crashes (e.g., 2008, early 2022) if rebalancing timing aligns
Behavioral Edge: Reduces panic selling by systematizing exits
Tax Efficiency: Monthly rebalancing makes this better for IRAs or deferred accounts
🚩 Major Drawbacks
Overreliance on a Single Lookback (12 months):
Doesn’t adapt to different volatility regimes
Suffers in choppy or sideways markets
Binary Decision Tree:
Either fully in SPY or VEU or fully in cash — no partial positioning
May lead to whipsaws or missed rebounds
Post-Hoc Bias Risk:
12-month momentum is academically robust, but its use here might be optimized in hindsight
International Weakness:
VEU underperformance dragged down the whole model in 2010s
Concentration in U.S. assets would have worked better with hindsight
🔧 Ways to Potentially Improve It
Add Volatility Targeting: Risk-adjusted momentum (e.g., Sharpe over 12 months)
Blend Multiple Lookbacks: Combine 3-, 6-, and 12-month momentum
Expand the Universe: Add small caps, gold, REITs, or bonds for diversification
Smooth Transitions: Use moving averages or multi-step allocation shifts to reduce whipsaws
🤔 Final Verdict
Dual Momentum is a beautifully simple model with academic justification and backtested success. But real-world data since its popularization shows that it may struggle in extended U.S. bull markets and may underperform in environments where cash is penalized by inflation or rate volatility.
That said, it still shines as a low-volatility, behavioral-friendly strategy, especially for conservative investors or tax-deferred accounts.
For active users, consider using Dual Momentum as a base layer — and then adapt it with volatility filters, multiple timeframes, or a broader asset class universe.
📚 Appendix: Key Terms & Definitions
Dual Momentum
A tactical investment strategy that combines relative momentum (which asset is stronger?) and absolute momentum (is the asset rising at all?) to select between two or more risk assets, or move to cash if neither asset is strong.Relative Momentum
A rule that compares the total return of two or more assets over a fixed lookback period (e.g., 12 months) and selects the one with the highest performance.Absolute Momentum (Trend Following)
A filter that only allows investment in an asset if its historical return over the lookback period is positive. If not, the portfolio moves to a safe asset like cash or short-term bonds.Lookback Period
The number of days, months, or years used to measure past performance or volatility. Common lookbacks include 3, 6, and 12 months.CAGR (Compound Annual Growth Rate)
The average annual growth rate of an investment over a period of time, assuming profits are reinvested. Smoothed metric that ignores volatility.Max Drawdown
The maximum percentage decline from peak to trough in a portfolio’s value. Measures the worst historical loss and is a key risk metric.Volatility Targeting
An approach that adjusts position sizing based on recent price volatility, aiming to keep portfolio risk constant over time. For example, a riskier asset gets a smaller weight.Sharpe Ratio
A measure of risk-adjusted return, calculated by dividing the portfolio’s excess return over the risk-free rate by its standard deviation. Higher is better.Rebalance Frequency
How often a portfolio is updated or realigned to follow a model’s rules — monthly rebalancing is standard in most momentum strategies.Whipsaw
A scenario where a trading model rapidly flips between positions due to short-term noise, often buying high and selling low. Common in sideways markets.Backtest
A simulation that applies a trading or investment strategy to historical data to estimate how it would have performed in the past.Overfitting
A modeling error where a strategy is too closely tailored to past data, including noise, making it less robust in future real-world conditions.Risk-On / Risk-Off
A framework used in tactical models to describe asset exposure based on market conditions. Risk-on assets include stocks and commodities; risk-off includes cash, bonds, or gold.Momentum Decay
The idea that returns from momentum strategies can diminish over time due to crowding, changing market regimes, or model commoditization.
About the Author: Peter Richman, MD, MBA is a Professor of Emergency Medicine and former Registered Investment Advisor. At TradeRounds, he applies the same evidence-based diagnostics used in medicine to financial markets.