



Small caps lost money in November, but they held up better than the S&P 500. Through November 20, the TradeRounds Market-Cap HAA model’s November holding, IJR, was down 6.44%, while SPY was down 8.72%. That’s a difference of 2.28 percentage points.
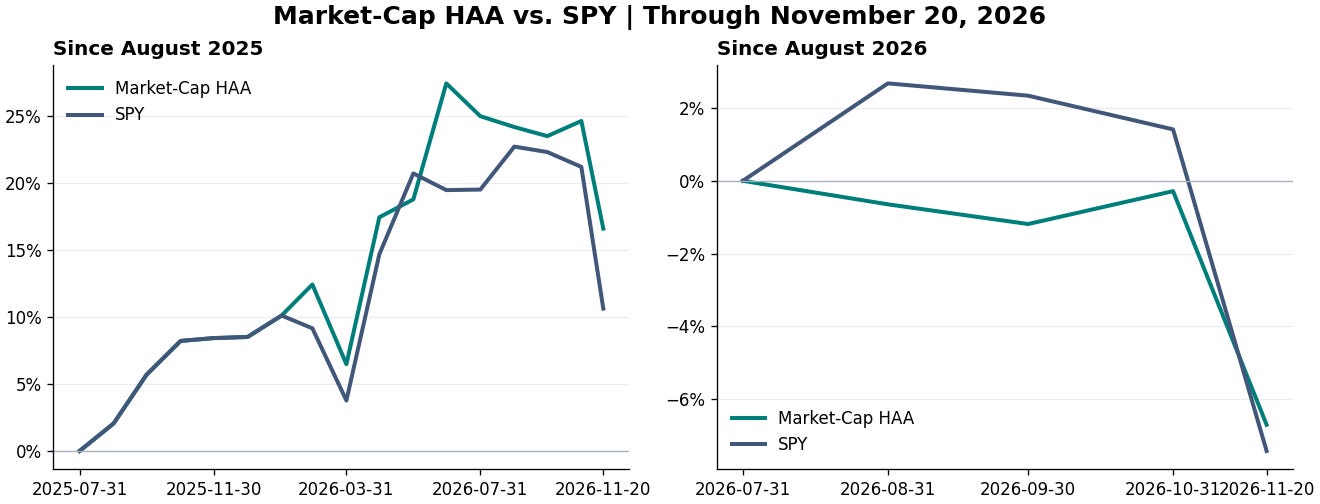
The starting date matters. The model still trailed SPY from August 1, 2026, and led over the longer period beginning at the model’s August 1, 2025 launch. Here’s what it held and how the returns compare.
Market-Cap HAA performance vs. SPY
August 2026 (IJR) · HAA −0.65% · SPY +2.68%
September 2026 (SHY) · HAA −0.55% · SPY −0.33%
October 2026 (SHY) · HAA +0.92% · SPY −0.91%
November through Nov. 20 (IJR) · HAA −6.44% · SPY −8.72%
Since Aug. 1, 2026 · HAA −7.56% · SPY −6.58%
Since model launch, Aug. 1, 2025 · HAA +16.58% · SPY +10.61%
August was the weakest month for the model relative to SPY in this four-month comparison. IJR declined as large caps advanced. The defensive holding, SHY, helped in October when it gained 0.92% as SPY lost 0.91%. November’s IJR allocation narrowed the cumulative gap since August to 0.97 percentage points, calculated before rounding.
Why the model held IJR in November
The model calculates an equally weighted average of adjusted returns over 1, 3, 6, and 12 months. It applies that calculation to TIP, an inflation-protected Treasury ETF, at each month-end. When TIP’s score is positive, the model holds the highest-scoring equity ETF among SPY, MDY, and IJR. When TIP’s score is zero or negative, the model holds SHY, a short-term Treasury ETF.
At the October 30 close, TIP’s composite was +0.324%. IJR led the equity candidates at +5.891%, ahead of SPY at +4.547% and MDY at +3.697%. That made IJR the model’s November holding. The next allocation is determined at the November month-end review.
How the returns were calculated
The table and chart use Stock Analysis adjusted closing prices and the original month-end-close research convention. Longer-period returns are compounded. The model record was reconstructed from its rules, and some monthly signals were unpublished. November is a partial month. Figures are before modeled trading costs. Applying a 0.05% modeled switching charge to the November move from SHY to IJR gives a November model return of −6.49% through November 20.
Disclosure. TradeRounds provides educational investment research. Model results are hypothetical and do not represent actual account returns. Past performance does not guarantee future results. This article is not personalized investment advice.
AI assistance. ChatGPT assisted with drafting, return calculations, chart preparation, and the cover illustration.
Thanks for reading TradeRounds. Subscribe for free to receive monthly model updates.